|
|
Review: Intel DC P3700 1.6TB NVMe Enterprise SSD |
Welcome to Myce’s review of the Intel DC P3700 1.6TB NVMe Enterprise
SSD (hereafter referred to as the Intel P3700).
This is the first NVMe drive we have reviewed. NWMe stands
for ‘Non-Volatile Memory express’. NVMe, is a specification that allows a
solid-state drive to make effective use of a high-speed Peripheral Component
Interconnect Express bus in a computer. Intel has taken a leadership role in
the implementation of NVMe and is the first to bring an NVMe drive to market.
Fortunately for Myce, our partner OakGate Technology has
been at the forefront of NVMe testing and validation. OakGate’s Marketing
Director, Vipul Mehta says - "OakGate Technology was the first company to
offer an advanced test platform for NVMe flash storage. Working closely with
industry leaders, the company has incorporated a number of cutting-edge
features and functions for PCIe flash products supporting both NVMe and AHCI
protocols. Today, all leading suppliers of solid state storage rely on
OakGate's systems for test and validation of their NVMe products." Check
out Oakgate’s website - here
So please read this review for an authoritative performance
assessment of the Intel P3700 – it is a truly amazing drive!
Market Positioning and Specification
Market Positioning
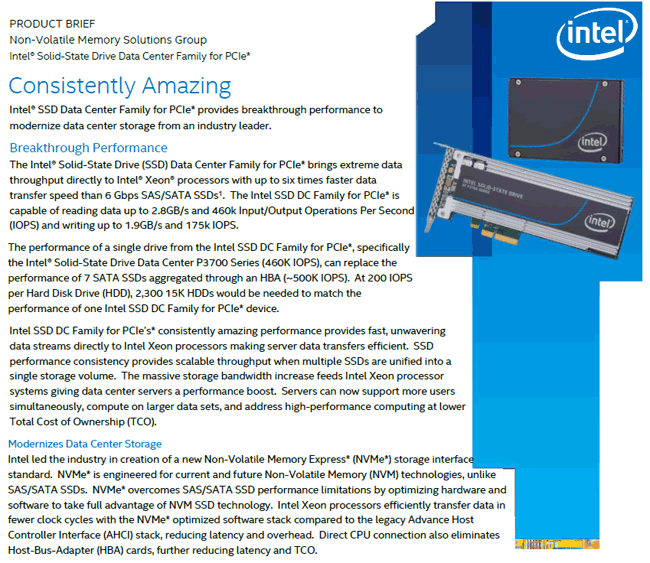
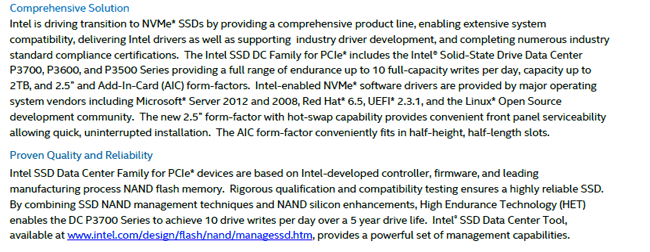
This is how Intel positions the Intel P3700 –
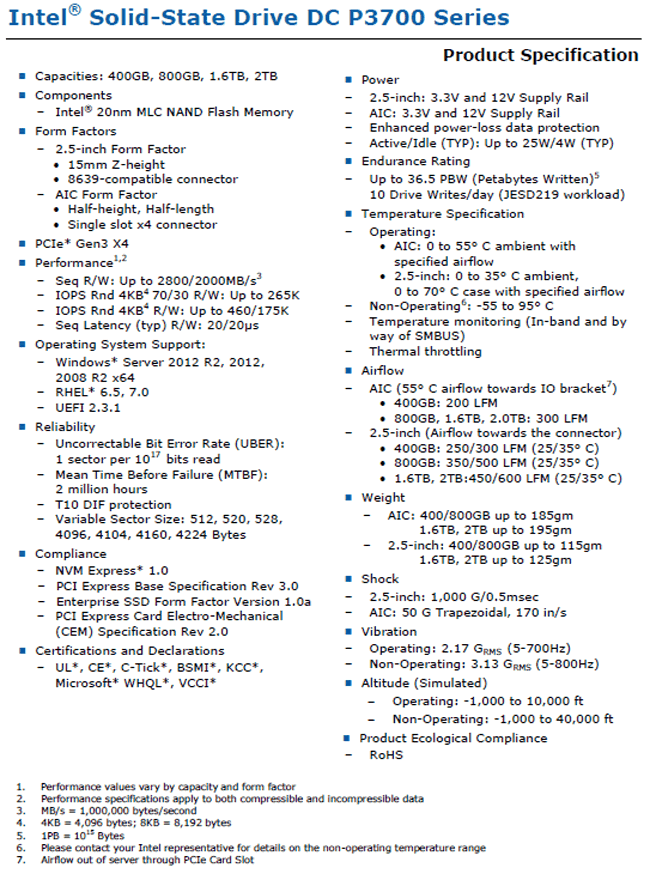
Specification
Here is Intel’s specification for the Intel P3700 series –
NVMe
Here is a brief introduction to NVMe, taken from the NVMe
organisation’s website –

The NVM Express specification, developed
cooperatively by more than 80 companies from across the industry, was released
on March 1, 2011, by the NVMHCI Work Group (commonly referred to as the NVM
Express Work Group). The NVM Express 1.0 specification defines an optimized
register interface, command set and feature set for PCI Express®
(PCIe®) Solid-State Drives (SSDs). The NVM Express 1.1 specification
was released on October 11, 2012 adding additional Enterprise and Client
capabilities. The goal is to deliver the full performance capabilities of
current and next generation non-volatile memory, supporting at least a 10 year
life of the interface, while standardizing the PCIe SSD interface to enable
broad ecosystem support.
The significant advances in performance
enabled by non-volatile memory-based storage technology, as embodied in
PCIe-based SSDs, has demanded the surrounding platform infrastructure evolve to
keep pace, to realize the full potential of these devices. A primary goal of
NVM Express is to provide a scalable interface that unlocks the potential of
PCIe-based SSDs now and at least a decade into the future. The interface
efficiently supports multi-core architectures, ensuring thread(s) may run on
each core with their own SSD queue and interrupt without any locks required.
For Enterprise class solutions, there is support for end-to-end data
protection, security and encryption capabilities, as well as robust error
reporting and management capabilities.
The NVM Express Work Group is directed by a
multi-member Promoter Group of companies that includes Cisco, Dell, EMC, HGST,
Intel, LSI, Micron, NetApp, Oracle, PMC-Sierra, Samsung, SanDisk and Seagate.
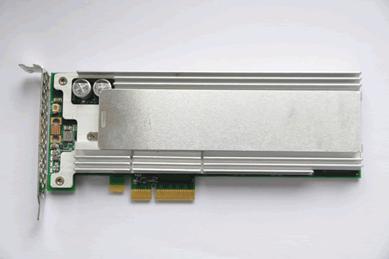
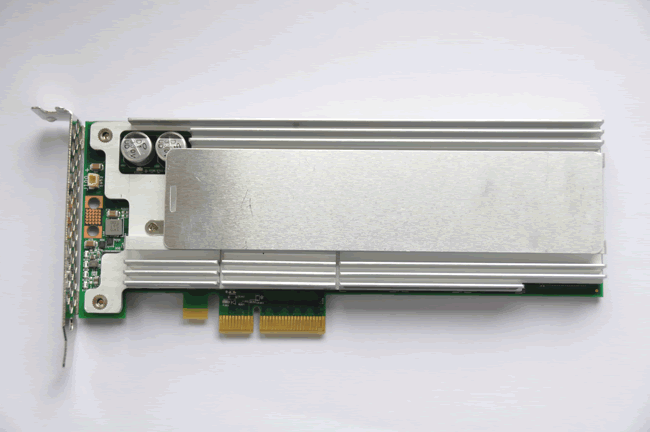
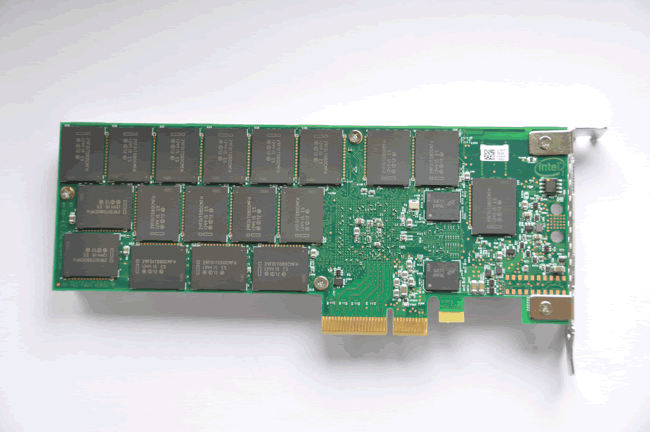
Product Image
Here are some pictures of the Intel P3700 1.6TB we tested –
Now let's head to the next page, to look at Myce’s
Enterprise Testing Methodology.....


")


