|
|
Review: Intel SSD DC S3700 200GB ADVERTISEMENT
|
Introduction
Welcome to Myce’s first Enterprise class Solid State Storage
(SSS) solution review.
We are delighted that this review is for an Intel DC S3700
200GB SATA SSD, which is widely regarded as a first class Enterprise solution.
The DC S3700 is a breakthrough product for Intel, which has
propelled them into, once again, being a competitive player in the Enterprise
Space. With the DC S3700 Intel has pushed a new byword and yardstick into the
evaluation of SSS solutions – “Consistency”.
So, we were excited to see if the DC S3700 would live up to
its reputation when scrutinised by Myce’s new OakGate Technology based
Enterprise Test Bench.
I take this opportunity to thank the excellent Intel
personnel that quickly and effectively responded to some questions that were
thrown up by our testing – more about this later.
Market Positioning and Specification
Market Positioning
As the ‘Data Center’ in the name suggests, Intel targets the
DC S3700 directly at modern day Data Centres.
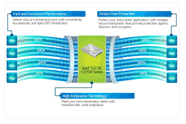
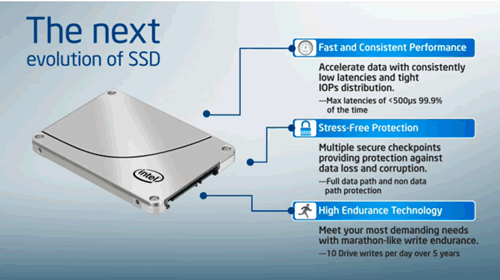
Here is how Intel positions the DC S3700 (taken directly from
Intel’s web site).

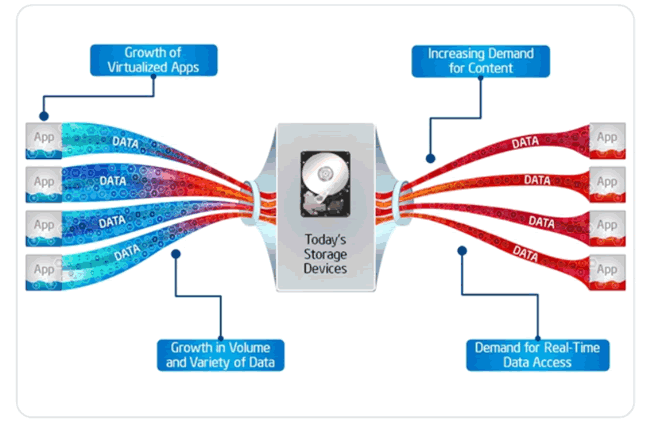

The pictures above serve as a useful reminder that the rate
of data transfer is not really so much about the speed data moves at, but is
about the width of the channel that it travels along. To use a well used
analogy – the wider a motorway is (the more lanes it has) then the more cars
that can pass along at any given speed.
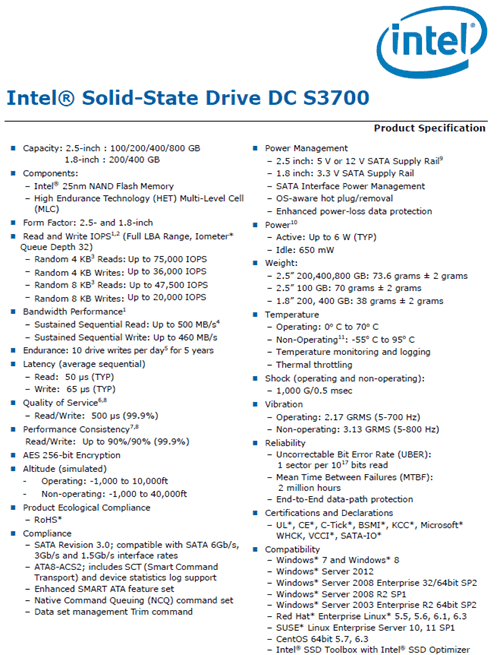
Specification
Here is Intel’s detailed specification for the DC S3700
(taken directly from Intel’s Product Specification PDF) -
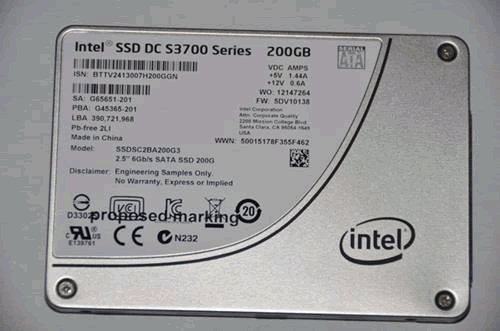
Product Image
Now let's head to the next page, to look at Myce’s
Enterprise Testing Methodology.....


")


