|
|
Review: Corsair MP300 240GB Reviewed by: J.Reynolds Provided by: Corsair Firmware: E8FM11.7 |
Introduction
Welcome to Myce’s review of the Corsair MP300 240GB NVMe SSD
(hereafter referred to as the Corsair MP300).
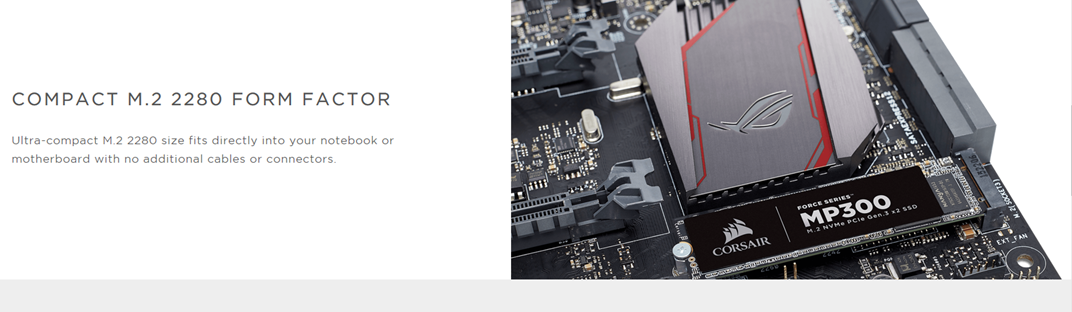
The Corsair MP300 is the first m.2 NVMe drive I have tested,
that uses only 2 PCIe lanes (whereas the Samsung 970 EVO and the Adata SX8200,
that I had tested recently, use 4).
This should give the Corsair MP300 a price advantage but
will it compromise performance – please read on to find out.
Packaging
To get started let’s have a look at the Corsair MP300’s
packaging -
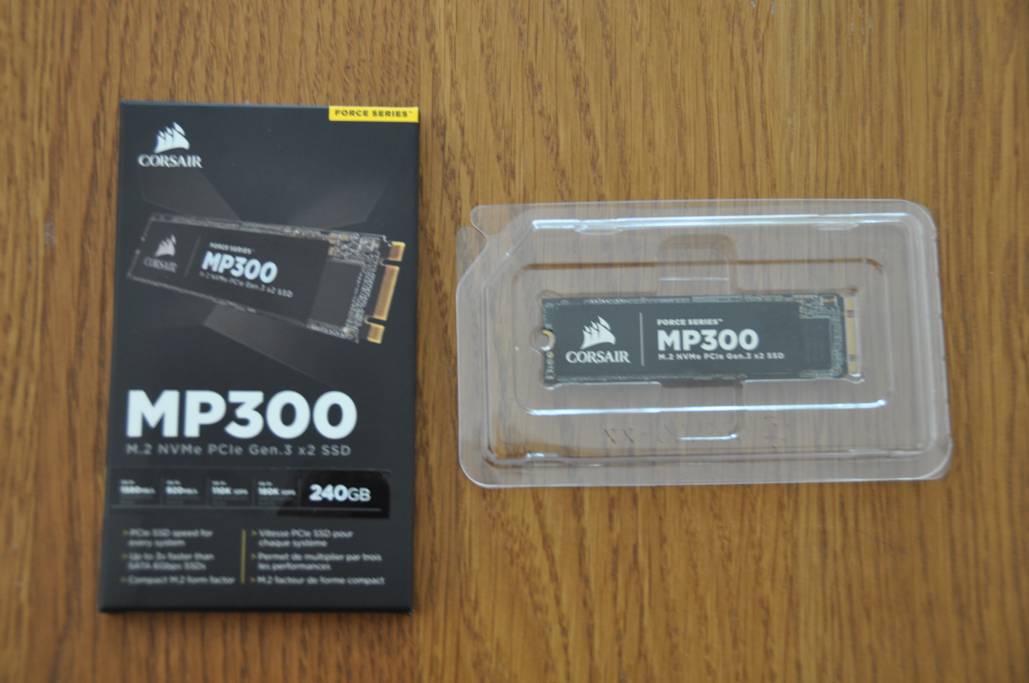
High quality packaging, which is typical of Corsair.
Market Positioning and Specification
This is how Corsair positions the MP300 -
Here is Corsair’s specification for the MP300 –
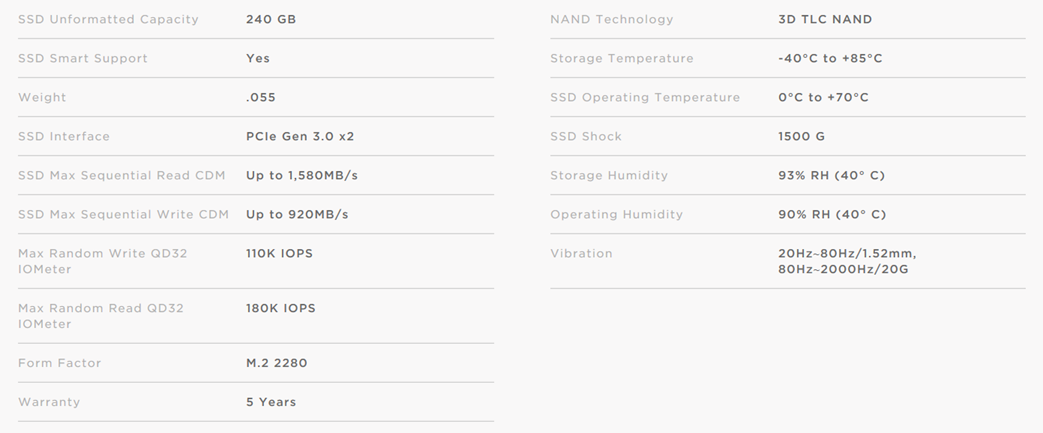
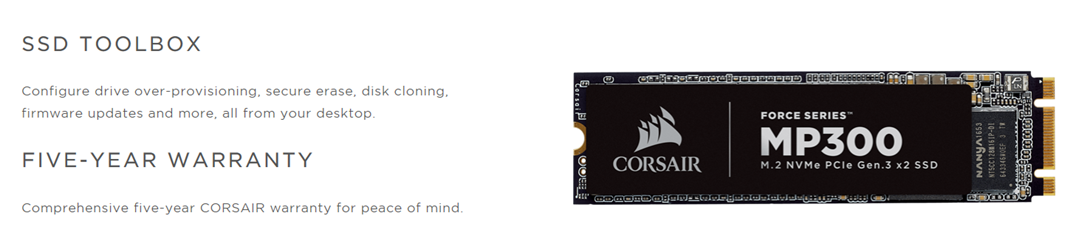
Curiously, Corsair does not specify an expected endurance
level for the MP300, but it does provide a 5 year warranty.
Now let's head to the next page, to look at my approach
to testing Client SSDs.....


")


